Reports
Set up the data behind each Reports tab, understand every figure, and use practical examples to read the results.
analytics · campaign report · flow report · email revenue · marketing monitor · API email report · audience growth · ROI
Open Reports in your workspace. The tabs answer different questions: how your emails performed, what happened in a flow, whether messages reached inboxes, how your audience changed, and what value was recorded. External campaigns (Marketing monitor) measures events from a campaign sent by your own system; it has different rules from Azimea’s email reports.
Before you read a report
Section titled “Before you read a report”- Choose 7 days, 30 days, 90 days, 12 months, or a custom date range. Presets include today. Custom dates include both selected days. The maximum range is 400 days.
- For the standard reports, Compare shows the equally long period immediately before your selection. A percentage change is omitted when the earlier value is zero or unavailable. Marketing monitor has no comparison switch.
- Check the prerequisites in the tab below. A zero may mean no activity, while a dash means that a rate has no denominator or a cost has not been set.
The dates use your browser’s time zone. Email outcomes are grouped by when the message was sent; conversions and their value are grouped by when the result happened. This matters around the edge of a selected period.
For attributed revenue, connect a store or your own system, and check received events under Events → Recent events. Configure custom outcomes under Measurement and results → Conversions. Paid orders are already a conversion. Under Measurement and results → Attribution, choose the window and model. Open Costs and margin for return calculations. Attribution connects a recorded result to an email under those rules. It does not by itself prove that the email caused the result.
Email rates use delivered messages as the denominator for opens, clicks, complaints, and unsubscribes. If delivery confirmations are unavailable, the report uses sent minus bounced as the delivered estimate. For example, 40 human clicks among 800 delivered messages is a 5% click rate. Opens and clicks count detected human activity; privacy protections and disabled tracking can leave them unmeasured.
Configure conversion events
Section titled “Configure conversion events”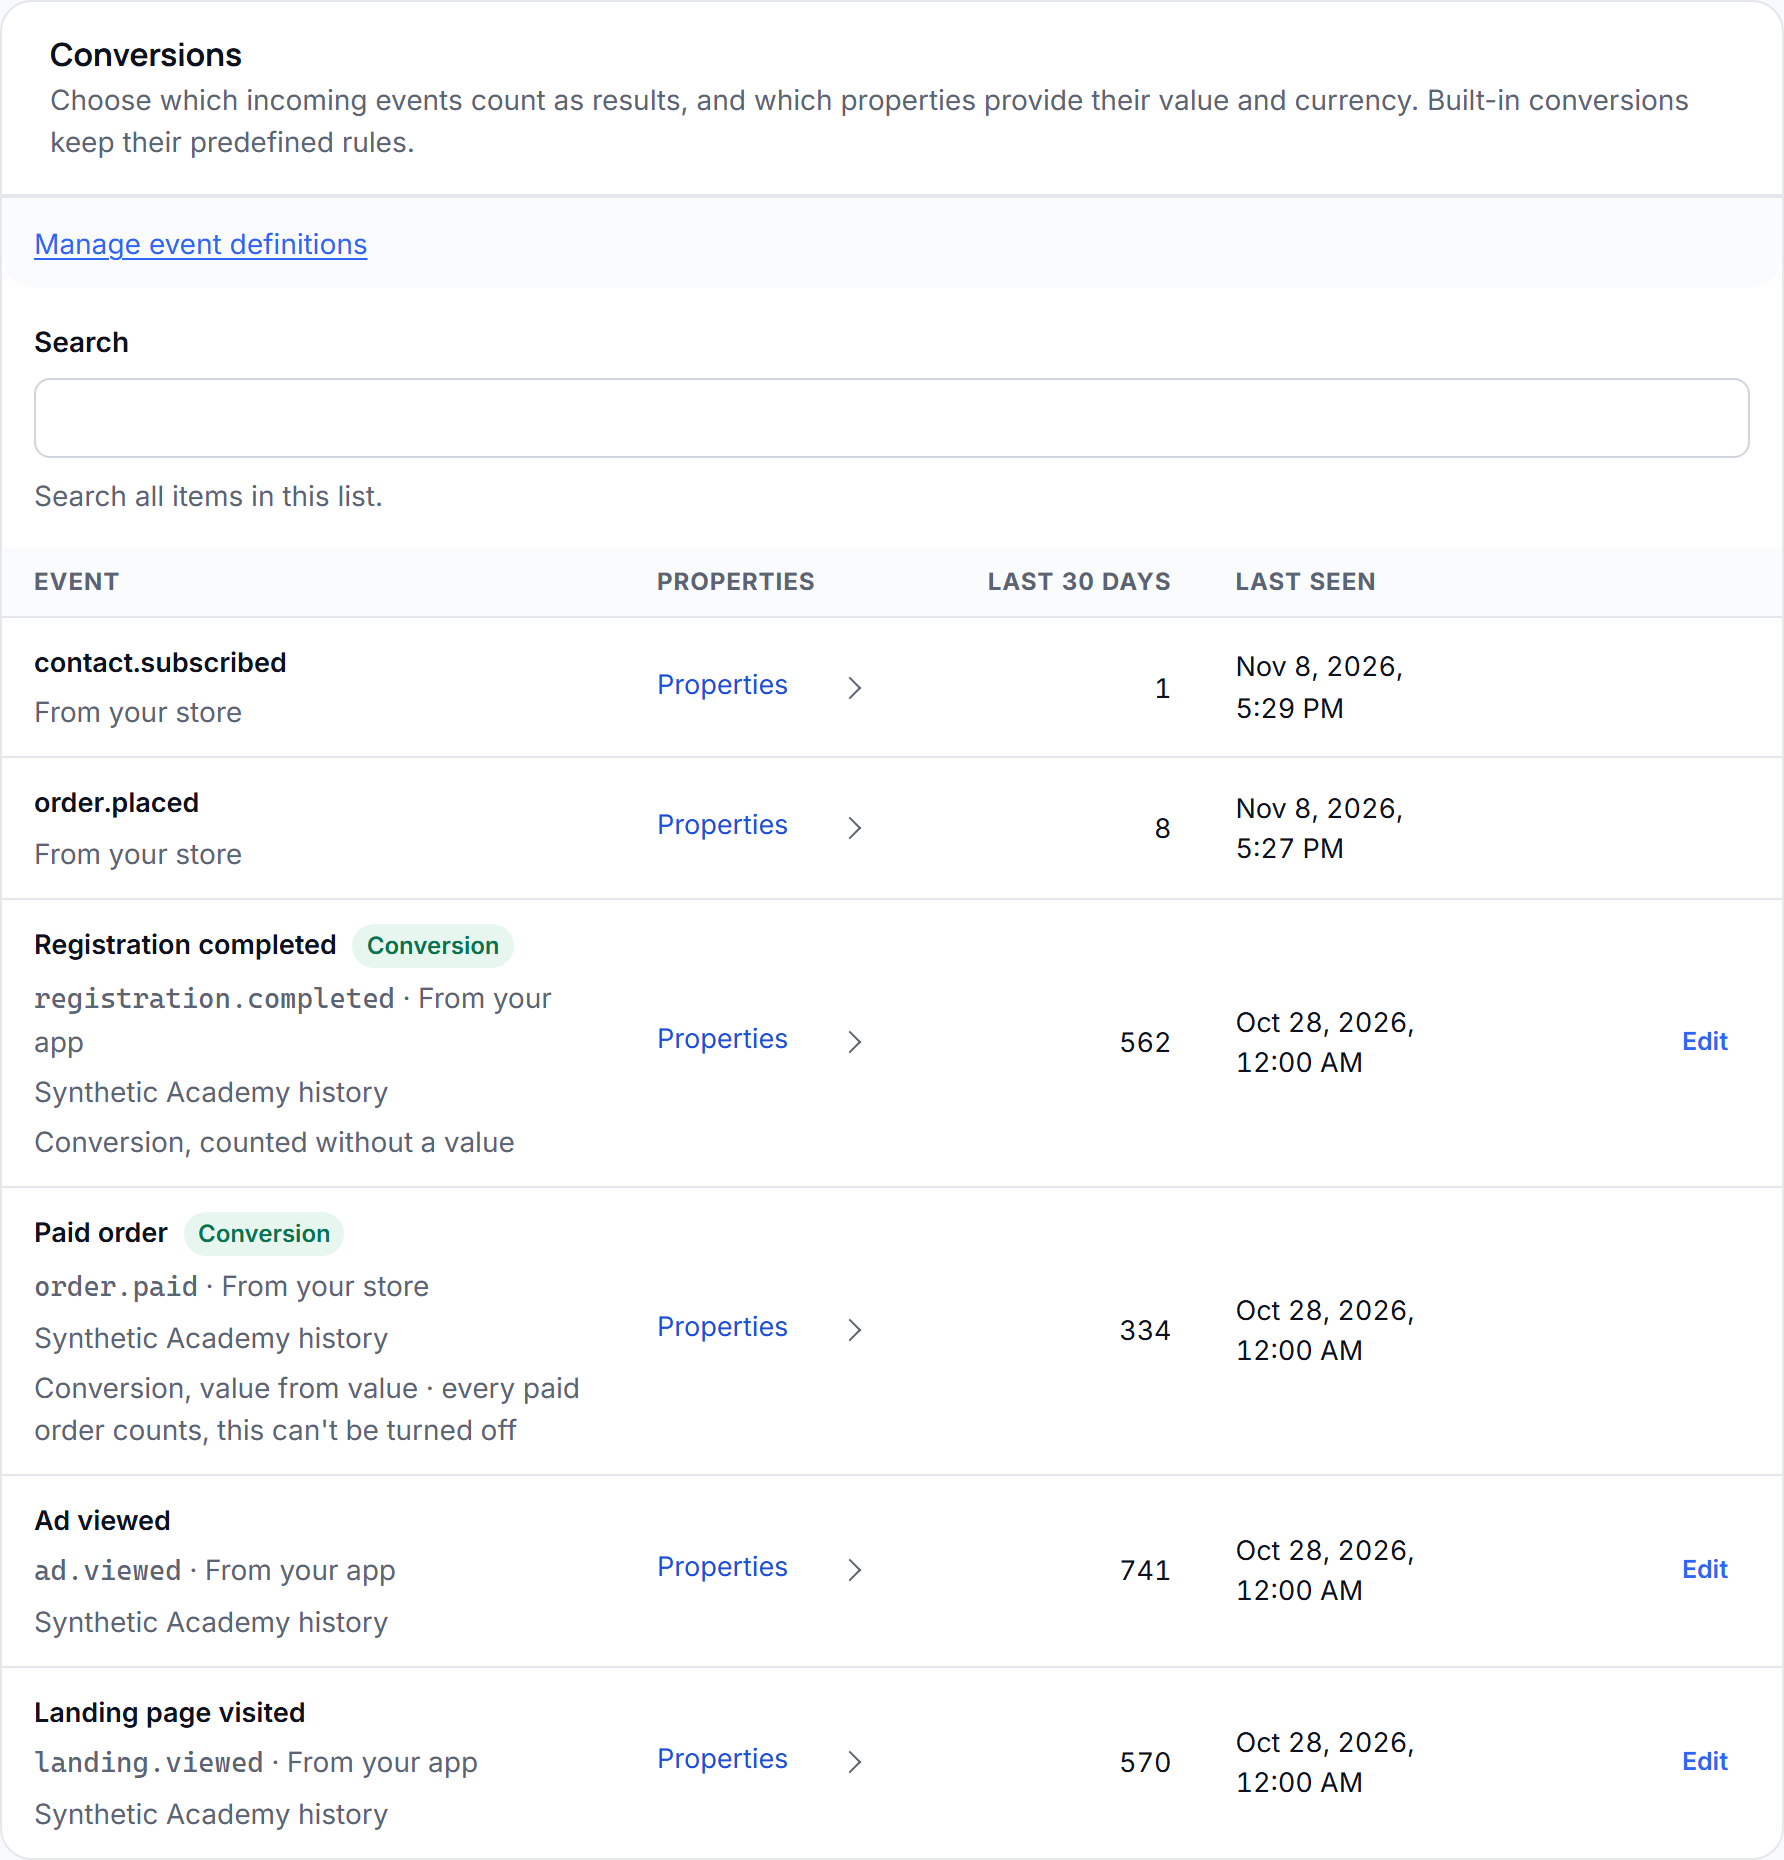
Send an event from your system using the Events API. In Events → Event types, give the event a readable name and description. Then open Measurement and results → Conversions, edit it and select Count as a conversion if this event represents a business outcome. Choose the event property containing its value and the property containing its currency when you send monetary amounts. Save the type. Future events use this conversion setting; existing results are not recalculated. Built-in paid orders already count as conversions and cannot be changed here. Open Events → Recent events if an expected event is missing or rejected.
Configure attribution
Section titled “Configure attribution”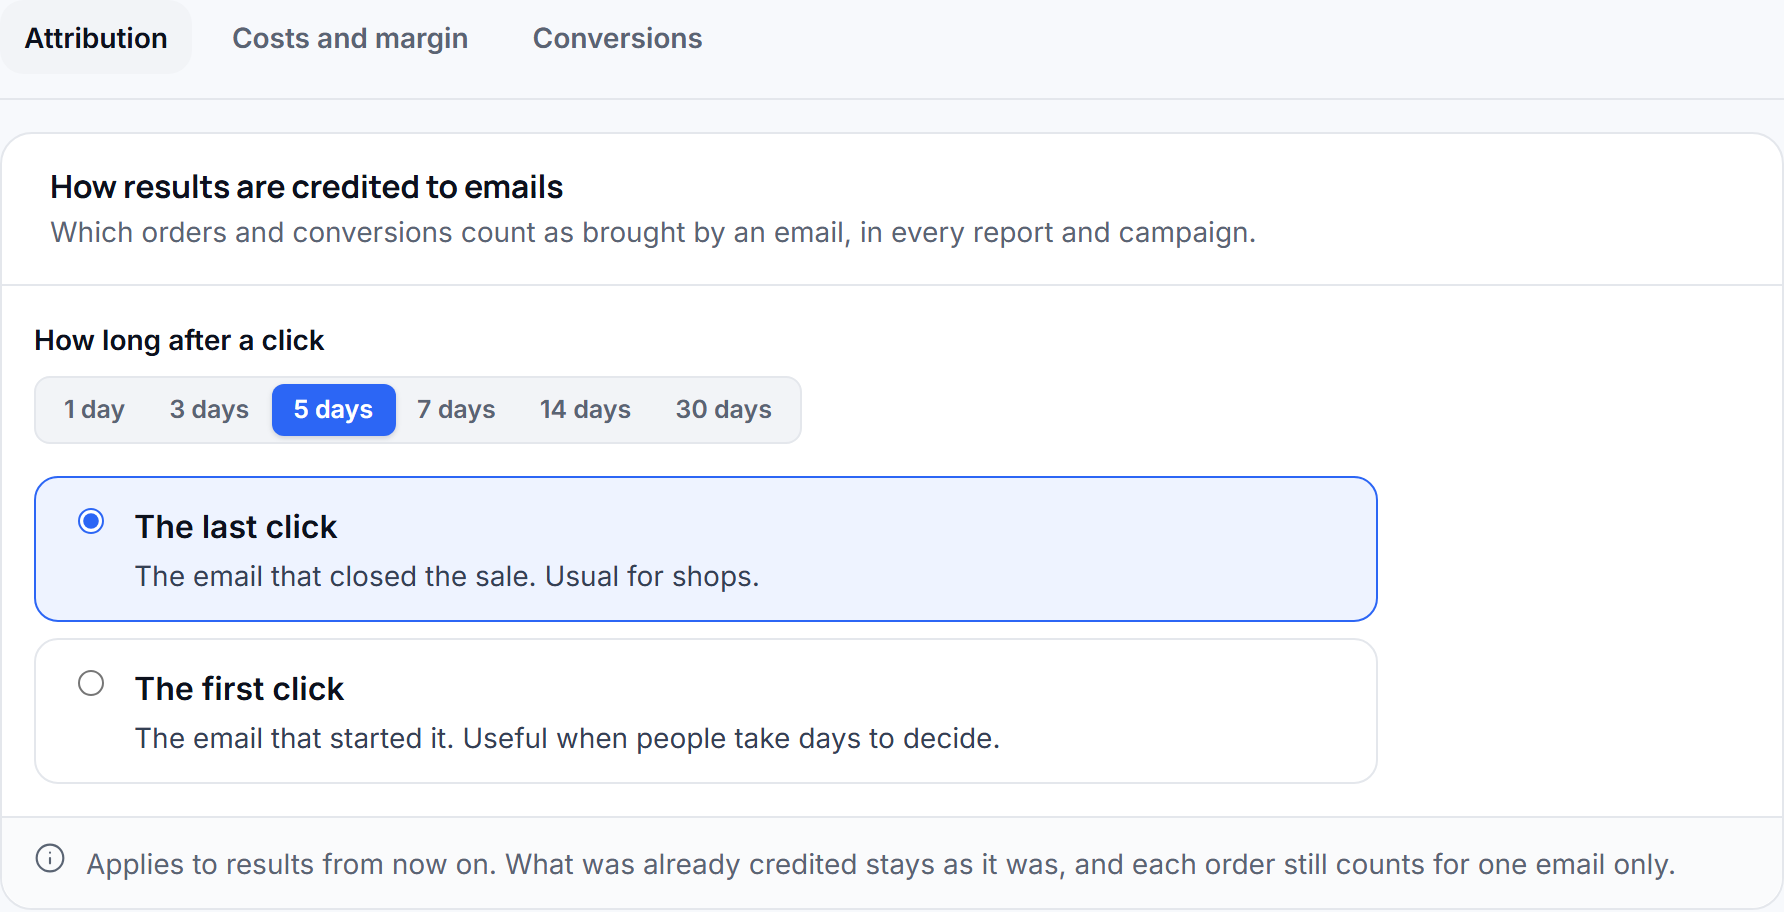
In Settings › Measurement and results, choose how many days after an email click a conversion may be credited. Then choose The last click to credit the most recent qualifying email or The first click to credit the earliest qualifying email. Each order is credited to at most one email. The choice saves when you select it: changing it applies to results from then on and does not rewrite earlier attribution. The setting affects reports and campaign results; it describes an association under your chosen rule, not proof of an incremental effect.
Configure costs and margin
Section titled “Configure costs and margin”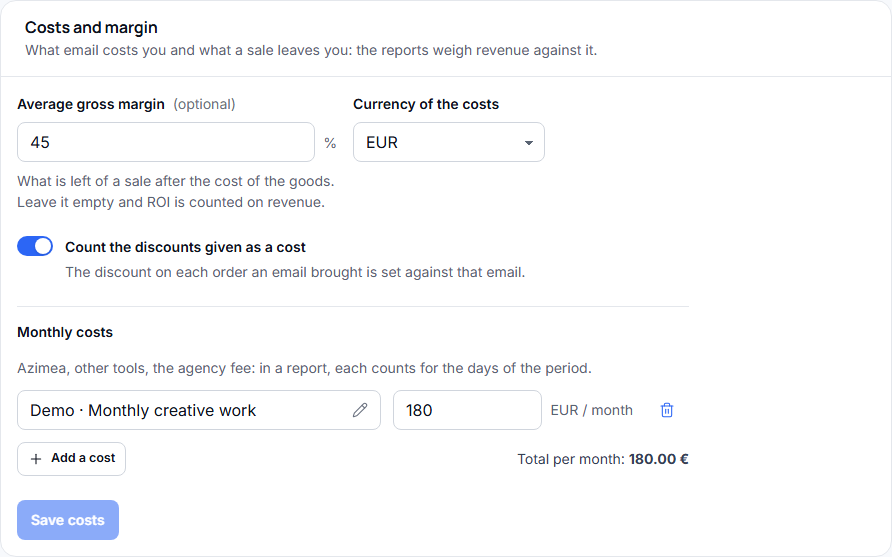
In Settings › Measurement and results, open Costs and margin. Select the cost currency, enter your average gross margin if you know it, and decide whether discounts attributed to email should count as a cost. Add each monthly fixed cost, such as a platform subscription or agency fee; reports allocate those amounts to the selected period’s days. Enter campaign budgets where you manage campaigns. Save the costs before comparing return. With no cost basis, return and ROI are unavailable. With no margin, ROI uses revenue; with margin, it uses estimated gross profit. Check that revenue and cost currencies match the figures you intend to compare.
Overview
Section titled “Overview”What it shows: Attributed conversion value, delivered emails, human open rate, human click rate, unsubscribe rate, and return when costs are set. You can switch the trend chart between value, deliveries, and open rate. Below it are findings, campaigns ranked by value per delivered email, a breakdown of attributed value by source, and the days and hours when people first opened messages. A weekly summary may appear when one is available.
Set it up: Send a campaign or publish a flow; make sure outcomes arrive from your store or application. Set the attribution rule in Settings › Measurement and results. Enter costs there if you want return in the KPI cards.
Example: If 800 emails were delivered and 40 people clicked, the click KPI reads 5%. If conversions worth 2,000 RON happened in the period, the value KPI reads 2,000 RON. Those conversions may come from emails sent before the period began.
Campaigns
Section titled “Campaigns”What it shows: One row per Azimea email sent in the selected period: delivered count and delivery rate, open rate, click rate, click-to-open rate, attributed conversion value, value per delivered email, unsubscribe rate, and complaint rate. Sort a column to compare campaigns. Once costs are configured, a return multiple and the campaign’s direct cost appear. A campaign with a measured control group can also show estimated additional value and whether the evidence reaches the report’s confidence threshold.
Set it up: Send a campaign, check its delivery and conversion events, then enter reporting costs if you need return. Set a control group in the campaign before sending if you want an incremental estimate.
Example: A campaign with 1,000 delivered emails, 100 opens, and 50 clicks shows 5% click rate and 50% click-to-open rate. If its attributed value is 900 RON and its direct cost is 300 RON, its return is 3×. The campaign row follows the campaign’s results even when a conversion happens after the selected send period.
Open an email name in the period table to inspect it inside Reports › Campaigns. The main Reports tabs stay visible. Use the campaign picker to search all campaigns, including older results, and choose an email when the campaign contains several. A campaign with one sent email opens that email’s analysis immediately. The chart icon beside each campaign’s contextual menu in Campaigns opens this same selection.
Campaign analysis and timeline
Section titled “Campaign analysis and timeline”With All campaigns selected, the table follows the Reports period. Selecting a specific campaign switches to its Campaign lifetime results; period controls and unrelated period exports are hidden. The lifetime label and Compare action sit beside the campaign picker. The selected campaign name appears there once.
Email information is split into these views:
- Summary leads with six core figures, optional additional metrics, visible delivery warnings, benchmarks and applicable A/B or control-group results.
- Activity shows when opens and clicks were recorded; an explanation replaces the chart when no reactions are available.
- Links shows the links people clicked and their results.
- Conversions shows attributed outcome types and available language-version results.
- Recipients contains the searchable, filterable recipient list and its CSV export for owners and admins. Filters remain selected while switching views of the same email.
- Sent email contains the subject, sender, audience and content preview.
- Timeline groups the campaign’s emails by day, shows exact local times and distinguishes sent, upcoming and attention-needed messages. For sent emails, open the email’s name or the arrow beside it to see its Summary within Reports. Drafts without a date appear separately; long sequences reveal more entries on request.
For a multi-email campaign, Whole campaign shows combined Summary, Emails and Timeline views. Rates use combined denominators rather than averaged email percentages; recipients summed across emails are not unique people. Goals and budgets appear when configured. Incompatible currencies make aggregate money and monetary progress unavailable while counts remain readable.
Compare stays inside the Campaigns tab, starting with primary outcomes and revealing reaction charts under Response over time. Sharing and other secondary actions remain in their contextual menus when your role allows them. Draft and scheduled campaigns show guidance before results exist; their editing and sending controls remain in Campaigns. Agency client selection remains available throughout the report; administrative, resend and recipient export actions are unavailable there. Old report addresses open the same inline analysis. Public shared links retain their existing address.
What it shows: Flows with entries, email outcomes, attributed conversions and value. Select a flow to see its path: people entering, reaching an email or wait, receiving, opening or clicking an email, and completing the recorded outcome. Each step shows how many reached it and the percentage continuing from the relevant preceding step. Where a flow has a valid holdout, the report also shows an incremental estimate. The flow’s direct return appears when costs are available.
Set it up: Build and publish a flow with a trigger, and make sure the triggering and conversion events arrive. If you use a holdout, configure it before people enter the flow. Set costs in Settings › Measurement and results for financial return.
Example: If 100 people enter and 80 receive the first email, the delivery step shows 80 people and 80% continuing from entry. If 20 of those 80 open it, the next step shows 20 people and 25%. A wait can include people whose email bounced, so its count can be greater than the delivered count; read the step names before comparing them.
API emails
Section titled “API emails”What it shows: Submissions accepted through Azimea’s API or SMTP, recipients, sent and delivered counts, delivery rate, queued, scheduled, retrying, failed, suppressed, bounced, complained, human opened and clicked counts. The chart shows their trend. Summary starts with four key counts, a trend and the five most recent submissions; expand More delivery metrics for the remaining outcomes. History contains the complete submission list with its filters and pagination; opening one shows its recipients and latest outcomes. Search by recipient, subject, submission or order ID, and filter by status, sender, template or tags. Export downloads a CSV of at most 10,000 matching submissions.
Set it up: Send your application’s messages through the email API or SMTP, using a verified sending domain. The report does not include Azimea campaigns, flows or flow tests.
Example: One accepted submission addressed to three people counts as one submission and three recipients. If two are delivered and one bounces, the recipient outcomes show two delivered and one bounced. A retry with the same idempotency key does not create another submission. The selected period groups submissions by acceptance date and shows their latest delivery outcomes.
Marketing monitor
Section titled “Marketing monitor”What it shows: Campaign exposure cohorts from events sent by your own system, later business outcomes in the order you configure, and rates calculated only after the complete outcome window has elapsed. It separates exposures still waiting for that window. Data health shows missing campaign_id, people exposed to several campaigns, counts and last-seen times for each event, and events recorded more than 24 hours late. For cohorts with at least 20 complete windows, it names the largest observed step losses. An owner or admin can record each campaign’s total cost; it is not a period ROI. This tab currently has no CSV export or report-sharing action.
Set it up: In Reports › External campaigns › Configure, enter two to six event names in order, starting with the exposure, and choose a 1–30 day outcome window. Optional display names make steps and campaigns readable while their integration codes remain stable. Select a campaign to inspect its journey; expand Check report data for ingestion diagnostics. Send an identified contact and a string campaign_id on each exposure through POST /events. Later outcomes must use the same contact identity. The Marketing monitor guide has a request example and the event rules.
Example: A campaign exposes 30 distinct contacts. The seven-day outcome window has completed for 24 of them, while 6 are still waiting. If 12 of the 24 complete the next stage, that stage reads 12 (50%). An outcome observed afterward is a fact about those people, not proof that the campaign caused it.
Deliverability
Section titled “Deliverability”What it shows: Delivery, bounce, complaint, and unsubscribe rates against the report’s warning bands; daily trends for bounces and complaints; and a breakdown by mailbox provider with its share, delivered, bounced, complained, and opened counts. The trend uses a rolling seven-day rate, which is less noisy than a single day’s small sample. These bands are product guidance, not a guarantee of inbox placement.
Set it up: Verify your sending domain and sender, then send enough messages for a meaningful sample. Delivery and bounce information depends on the sending events reaching Azimea.
Example: Of 1,000 sent messages, 980 are delivered and 10 bounce. Delivery is 98% and bounces are 1%. If the complaint rate rises for one provider, inspect the affected campaigns and audience rather than treating an open-rate change as a delivery failure.
Audience
Section titled “Audience”What it shows: The current sendable audience divided by its last sign of activity: active (up to 30 days), warm (31–90), cooling (91–180), and inactive (more than 180). Joining the list also counts as a sign of life, so a new subscriber does not start inactive. The growth chart shows contacts gained and lost during the selected period, by day for short ranges and by week for longer ones, plus net growth.
Set it up: Connect or import contacts with valid consent. Send emails so human opens and clicks can update activity. The tier snapshot is today’s sendable list; changing the date range changes the growth chart, not the snapshot.
Example: If the list gains 60 sendable contacts and loses 20 during the period, net growth is +40. A contact who joined last week is active even without an open yet.
Revenue
Section titled “Revenue”The dashboard names this tab Conversions & value. It supports applications, CRM systems, stores and other integrations that report business outcomes, such as account creation, qualified leads, subscriptions, upgrades or paid orders. Only outcomes attributed to an email appear here; this is not a total-activity report for the connected system.
What it shows: Conversion count first, a count/value trend by email source, and the source breakdown. Money is shown only when a monetary value was recorded. Missing amounts are unavailable, while an explicit zero is a recorded value. The average uses only conversions with a recorded value in the report currency; conversions in other currencies still count, but their amounts are excluded. For count-only outcomes the report shows counts, conversion types and sources without invented revenue or ROI. Sources without a campaign or flow identifier remain in an other-source category. With several types, use the type filters and expand the breakdown. Costs and return are available in a separate disclosure when monetary results exist; they keep the existing attribution, cost, margin and control-group rules.
Set it up: Connect your application, CRM or store, or send conversion events through the Events API. Mark custom business outcomes as conversions in Settings › Events; monetary value is optional. For financial results, supply value and currency. Choose attribution settings and enter monthly fixed costs, campaign budgets, whether discounts count, and an optional gross margin under Settings › Measurement and results. Selecting one conversion type hides the overall cost return, because the costs paid for all types together.
Example: With 5,000 RON attributed value and 1,000 RON total cost, return is 5×. Without a margin, ROI is 400% on revenue: (5,000 − 1,000) / 1,000. With a 40% gross margin, estimated gross profit is 2,000 RON and ROI is 100% on profit: (2,000 − 1,000) / 1,000. Return remains 5× in either case. If total cost is zero, neither ratio is shown.
Export and share
Section titled “Export and share”The Export menu offers CSV, Excel and PDF for the selected period and standard tab. API emails has its own filtered CSV export. Marketing monitor currently shows its findings in the dashboard only. Eligible team members can share standard reports from the report actions menu; the shared view has fewer account controls. Check the selected period, time zone, attribution settings, and cost inputs before sending a figure outside your team.
Pages and feedback
Section titled “Pages and feedback”What it shows: Responses submitted through published Azimea pages during the selected period. Analysis shows the response volume, pages with feedback and applicable rating/NPS results. The responses view lets you inspect individual submissions and switch between active and archived responses. Empty periods show a setup guide instead of zero-filled charts; choose a different period if you expect older responses.
Create a page and collect your first response
Section titled “Create a page and collect your first response”- Open Pages. Choose Create page for a blank draft, or open the template library and select a starting model. The new saved draft appears in your page list.
- Add the text and form fields you need. Set required fields and their validation rules, then preview the page on desktop and phone. A preview is for checking the page, not collecting responses.
- Save and publish the page. Share its public link with the people whose feedback you want to collect. A draft alone cannot receive public responses.
- After someone submits a valid response, open Reports › Pages and feedback. Select a period that includes the submission, then use Analysis or Responses to inspect it.
Edit page structure and appearance
Section titled “Edit page structure and appearance”A new blank page starts with one empty form page and an editor placeholder. Use Add new page to add another form page. Below the last form page, the Add end page button adds an optional empty confirmation page. It appears only while no end page exists. The trash icon beside Duplicate page opens a confirmation before deleting that page. At least one form page must remain; deleting the first of several form pages moves the next one to the start. Undo restores a deleted page. Existing configured end pages retain their content. Without one, successful submission still shows the standard thank-you message. Drag or click the blocks you need to build the content. New intermediate pages also start empty. The document name stays in the editor controls; it is not added as visible page content. Ready-made templates and duplicated pages retain their content. Rename the document in the editor’s top bar. Add a Heading or Paragraph block wherever you want visible titles and introductory text; there is no fixed title/introduction section in Page settings.
The designer has three areas: Add blocks / Layout on the left, your pages in the center, and settings for the selected item on the right. Click a block to configure it. Text changes appear on the canvas as you type; use Content and Style where available to switch between its content and appearance. The designer opens on its own dashboard page. Its top bar stays fixed while the settings panel and page content scroll independently. On smaller screens, open the required panel with the workspace controls; scroll inside that panel to reach the remaining settings. Back to pages returns to the library after pending changes are saved. If a save fails, the editor keeps your changes and offers the existing leave confirmation. Headings and paragraphs can also be edited directly on the canvas. Selecting either shows a text toolbar immediately below the designer’s browser bar. Use it for font, size, color and alignment; headings also offer semantic level and weight. For paragraphs, bold, italic, underline, lists and links apply to the current text selection. Ctrl/Cmd + K opens the paragraph link editor; Escape closes it and restores the text selection. The toolbar stays with the browser bar as you scroll and its controls scroll sideways on narrow screens. Detailed typography and spacing remain in the right inspector. Settings sections start collapsed except for the first section. Open other headings as needed; selecting another block, row, column or page resets the panel to that initial state. Page settings → Page address is a separate collapsed group containing the page slug and submission access policy.
Mobile preview uses the page’s available content width, including its padding. Choice cards become a single column at 600 px of content width or less. By default, headings larger than 32 px are capped at 32 px when content is 400 px wide or narrower. In a heading’s Style → Typography, enable Custom phone font size to choose its size at that width. The same rules apply to published pages and narrow layout columns; your desktop font size and choice column count remain saved.
For question blocks, Content contains the question, supporting text, answers and validation. Choice presentation, columns and option spacing belong to Style → Choice layout. Rating symbols and display options also belong to Style. NPS retains its standard 0–10 scale; it is shown as information rather than an editable field. A submit button’s Content tab holds its label and destination; Style holds colors, size, alignment, full width and padding.
Click a palette item to add it, or drag it to the rounded blue Drop here marker between blocks. Hover over content to see its label; select a block or row to reveal its actions and circular edge grip. Use the grip to move the selection. Empty columns show a neutral dashed hint and an Add blocks action. The source keeps its space while dragging, so the page does not reflow before you release it. The floating Help and AI Studio controls stay hidden while Page Designer is open and return when you leave the editor. Drag a Layout preset over existing content to insert a row at the marked position, or into an available column to create a nested row. Header and Footer presets can also be dragged; they stay at the beginning and end of the page respectively, and each can appear only once. Move near the canvas edge to scroll during a drag. Press Escape, cancel the touch gesture, or release outside the canvas to cancel. Use More actions for Move up and Move down, or use the parent-selection arrow to inspect the containing column or row. Menus close after an action, on an outside click, or with Escape.
Hover near a row or column edge to reveal its label. Select the numbered column control to adjust that column’s size and alignment. You can also focus a row or column with Tab and select it with Enter or Space. Click the gray workspace outside the page to deselect the element and open Page settings. Choose the page font, base text size and text color; elements that inherit the page style update immediately. An element’s own typography settings take priority. Page settings also include background color or image, container width, border, corner radius, shadow, margins and padding. In Spacing → Margins, set each outer side independently; top and bottom are also the exact gaps inside the designer’s browser frame. Set a margin to 0 to remove that gap. Content alignment controls the text inside the container; minimum height gives vertical alignment room to work. The separate container alignment controls its position on the surrounding background. In Spacing, Between blocks controls the outer spacing for normal page blocks, and Inside columns controls the gap between blocks within layout columns. Both accept zero, independently of each block’s own space above/below. On smaller screens, the palette and settings stack around the canvas; the palette’s tiles scroll within their own area.
Use Undo and Redo to review edits. Drafts save automatically after a short typing pause, like email templates. The header shows when changes are saving, saved or not saved. You can use Save draft to save immediately or retry a failure. Leaving through the app saves pending changes first; if saving fails, the custom dialog lets you stay or discard the unsaved changes. Refreshing or closing the browser can still show its own warning while changes or image uploads remain unsaved. After a successful save, refresh keeps your draft without that warning. Preview lets you check the flow without collecting a response. Publishing applies the saved draft to the public page; autosave does not publish it.
Publishing a page does not send an email. If you want to distribute its link by email, add the public URL to a button or link in a campaign or flow. An empty response list can also mean that a search, page filter or period excludes the existing responses; clear those filters before creating another page.